CF: Validity and Reliability Criteria (2019)
In order to determine which nutrition parameters can be used to most accurately screen for and assess nutrition status in people with CF, the workgroup examined the validity and reliability of nutrition parameters through two methods: 1) determine the longitudinal relationship between nutrition parameters and hard outcomes (please see appropriate section) and 2) analyze studies that reported the validity (or data that could be used to calculate validity measures) or reliability of nutrition parameters compared to reference standards.
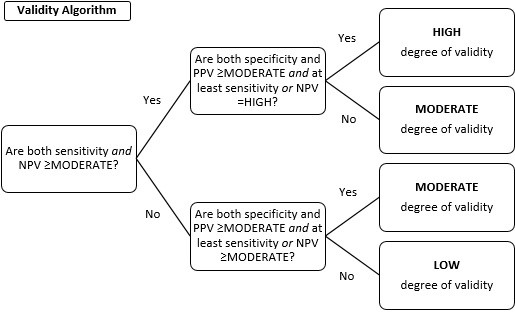
The framework for assessing the level of validity and reliability of nutrition parameters using validity and reliability studies was previously developed by the EAC for the Adult and Pediatric Nutrition Screening projects published on the EAL in 2018. When study authors reported validity measures (sensitivity, specificity, positive and negative predictive values) or reliability measures (kappa, Cronbach’s alpha, intraclass correlation coefficient), these were ranked as Poor to Excellent for that individual study. When more than one study was included for a specific nutrition parameter, the rankings for each study were used to determine an overall classification for each tool (Table 2). Since validity is typically assessed using four measures, overall classification for each of these measures was entered into an algorithm to determine overall validity (Figure 1). The measures of sensitivity and NPV were prioritized in this algorithm, since the measures being examined, primarily weight and growth parameters, may be most appropriately used as screening tools in this population with the goal of identifying anyone who may be at risk of malnutrition so that they can be proceed to a more comprehensive nutrition assessment from and RDN.
Table 2. Cut points for interpreting data of pediatric malnutrition screening tools
| Criteria for Individual Study Results | Overall Classification fo Each Tool |
|---|---|
| Validity Results | |
| SE, SP, PPV, NPVa | Overall Degree of Se, SP, PPV, NPV |
| 90 t 100% Excellent | High |
| 80 to 90% Good | Moderate |
| 70 to 80% Fair | Low |
| 60 to 70% Insufficient | Low |
| 50 to 60% Poor | Low |
| Reliability and Agreement Results | |
| Kappa Valueb | Overall Level of Agreement and Reliability |
| Above 0.90, Almost Perfect | High |
| 0.80 to 0.90, Strong | High |
| 0.60 to 0.79, Moderate | Moderate |
| 0.40 to 0.59, Weak | Low |
| 0.21 to 0.39, Mineral | Low |
| 0 to 0.20 None | Low |
| Cronbach's Alpha Valuec | Overall Level of Internal Consistency |
| a ≥ 0.9, Excellent | High |
| 0.9 > a ≥ 0.8 ,Good | High |
| 0.8 > a ≥ 0.7, Acceptable | Moderate |
| 0.7 > a ≥ 0.6, Questionable | Low |
| 0.6 > a ≥ 0.5, Poor | Low |
| 0.5 > a, Unacceptable | Low |
| ICC Valued | Overall Level of Test-Retest Reliability |
| > 0.90, Excellent | High |
| 0.75 to 0.9, Good | High |
| 0.5 to 0.75, Moderate | Moderate |
| < 0.5, Poor | Low |
Abbreviations: Se=sensitivity; Sp=Specificity, PPV=Positive predictive value; NPV=Negative predictive value
a Criteria were set based on Neelemaat et al.
b Criteria were set based on McHugh.
c a=alpha. Crieria were set based on Tavakol, et al.
d ICC=intraclass correlation coefficient. Criteria were set based on Koo et al.
Figure 1. Algorithm to determine overall level of validity from individual validity measures
Validity studies examining accuracy of body composition typically used Bland-Altman measures to examine validity of nutrition parameters compared to reference standards. This measure is preferable compared to mean comparisons, since the Bland-Altman plot demonstrates not only the mean bias of the test method compared to the reference standard, but also the limits of the agreement (95% confidence interval) and if the accuracy of the test method varies across measurements (ex: if the method’s accuracy varies according to body mass of the participant) (Giavarina, 2015). Thus, Bland-Altman plots cannot be interpreted with a straightforward number or cut-off value. Rather, evidence analysts and the workgroup considered all aspects of the Bland-Altman plot when determining accuracy of the examined tool.
References:
- Giavarina D. Understanding Bland Altman analysis. Biochem Med (Zagreb). 2015;25(2):141-51.
- Koo TK, Li MY. A Guideline of Selecting and Reporting Intraclass Correlation Coefficients for Reliability Research. J Chiro Med. 2016;15(2):155-163.
- McHugh ML. Interrater reliability: the kappa statistic. Biochem Med (Zagreb). 2012;22(3):276-82.
- Neelemaat F, Meijers J, Kruizenga H, van Ballegooijen H, van Bokhorst-de van der Schueren M. Comparison of five malnutrition screening tools in one hospital inpatient sample. J Clin Nurs. 2011 Aug; 20(15-16): 2,144-2,152. doi: 10.1111/j.1365-2702.2010.03667.x. Epub 2011 Apr 28. PMID: 21535274.
- Tavakol M, Dennick R. Making sense of Cronbach's alpha. Inter J Med Ed. 2011;2:53-55.