FL: Fluoride Exposure in the US (2010)
To estimate the total exposure and hazard risk of fluoride in infants and children in the US based on estimates from previous studies of various exposure pathways.
Not described.
Drew on US governmental agency data on reference dose. Drew on previous research to estimate exposure via different pathways.
Not described.
Selection of Studies
Not described
Design
Combined estimates of exposure from prior research to develop two models of exposure: A central measure of exposure and a high measure of exposure.
Blinding used
Not applicable
Intervention
None
Statistical Analysis
No inferential statistics used. Estimates based on epidemiological exposure model used by the US Environmental Protection Agency.
Timing of Measurements
Not applicable
Dependent Variables
- Exposure to fluoride in infants (less than one year)
- Exposure to fluoride in children three to five years.
Independent Variables
- Pathway
- Fluoride concentration
- Exposure frequency
- Exposure duration (years)
- Absorption factor
- Conversion factor
- Body weight
- Average time (365 days).
Control Variables
- Fluoridated vs. non-fluoridated drinking (tap) water
- Age.
- Initial N: Not applicable
- Attrition (final N):
- Age:
- Infants (less than one year)
- Children (three to five years)
- Ethnicity: Not applicable
- Other relevant demographics: Living in fluoridated vs. non-fluoridated areas
- Location: US.
Calculating Estimated Daily Intake
First, the authors used the following formula to calculate the estimated daily intake from each separate ingestion “pathway” (that is, the manner in which children and infants are exposed to fluoride via ingestion). The following formula was used to calculate estimated daily intake (EDI):
[Concentration x Intake rate x Exposure frequency x Exposure duration x Absorption factor x Conversion factor] / [Body weight x Average time]
Absorption and conversion were assigned a value of one since fluoride is readily absorbed through the gastrointestinal tract.
Identifying Pathways
Authors calculated two levels of EDI for each pathway: Central tendency exposure (what the “average” person in the age group is [CTE]); and the Reasonable maximum exposure (an estimate of the “upper level” of possible exposure [RME]. They examined eight different pathways.
Infants (<12 months)
| Pathway |
Concentration (range) |
Central Measure (recommended intake) |
CTE Estimated Daily Intake (mg/kg per day) |
Reasonable Maximum (90th percentile of recommended intake) |
RME Estimated Daily Intake (mg/kg per day) |
| Drinking water | 1mg/L (mean 1.01±0.15mg/L) |
Fluoridated area: 0.34L per day Non-fluoridated area: 0 |
Fluoridated area: 0.04 |
Fluoridated area: 0.88L per day Non-fluoridated area: 0 |
Fluoridated area: 0.1 Non-fluoridated area:0 |
| Soft drinks and fruit juice | 0.76mg/L (0.1 to 6.7mg/L) |
19 grams per day | 0.0017 | 23.75mg per day | 0.021 |
| Infant formula | 0.65mg/kg (means for different types range from 0.23mg/kg for ready-to-use formula to 1.13mg/kg for concentrate) | 198ml/feeding, 4.4 feedings per day | 0.067 |
214ml per feeding, 4.8 feedings per day |
0.079 |
| Cow's milk | 0.041mg/kg (0.007-0.086mg/kg) |
61 grams per day |
0.0003 |
76.25 grams per day | 0.00037 |
| Food | 0.262mg/kg (wide range depending on type of foods eaten) | 223.6 grams per day | 0.0052 | 612.7 grams per day | 0.014 |
| Incidental ingestion of soil | Not applicable | Not applicable | Not applicable | Not applicable | Not applicable |
| Fluoride supplements | Not applicable | Six to 12 months: 0.25mg per day NaF | 0.0074 | Six months to three years: 0.25mg per day NaF | 0.015 |
| Toothpaste | 1,000mg/kg | Not applicable | Not applicable | Not applicable | Not applicable |
| Cumulative Intake |
Fluoridated area: 0.11 Non-fluoridated area: 0.08 |
|
Fluoridated area: 0.20 Non-fluoridated area: 0.11 |
Children three to five years
| Pathway | Concentration | Central Measure (recommended intake) |
CTE Estimated Daily Intake (mg/kg per day) |
Reasonable Maximum (90th percentile of recommended intake) |
RME Estimated Daily Intake (mg/kg per day) |
| Drinking water | 1mg/L (mean 1.01±0.15mg/L) |
Fluoridated area: 0.4L per day Non-fluoridated area:0 |
Fluoridated area: 0.04 Non-fluoridated area: 0 |
Fluoridated area: 0.9L per day Non-fluoridated area: 0 |
Fluoridated area: 0.1 Non-fluoridated area: 0 |
| Soft drinks and fruit juice |
0.76mg/L (0.1 to 6.7mg/L |
269 grams per day | 0.0017 | 336.25mg per day | 0.021 |
| Infant formula | Not applicable | Not applicable | Not applicable | Not applicable | Not applicable |
| Cow's milk |
0.041mg/kg (0.007-0.086mg/kg) |
335g per day | 0.0003 | 418.75 grams per day | 0.00037 |
| Food |
0.262mg/kg (wide range depending on type of foods eaten) |
691.9 grams per day | 0.0052 | 1,312.5 grams per day | 0.014 |
| Incidental ingestion of soil |
430mg/kg (10-37,000mg/kg) |
0.1 gram per day | Not applicable | 0.4 grams per day | Not applicable |
| Fluoride supplements | Not applicable | 0.5mg per day NaF | 0.0074 | 0.5mg per day NaF | 0.015 |
| Toothpaste | 1,000mg/kg | 0.26g per brushing, one brushing per day | Not applicable | 0.77 grams per brushing, three brushings per day | Not applicable |
| Cumulative Intake |
Fluoridated area: 0.06 Non-fluoridated area: 0.06 |
Fluoridated area: 0.23 Non-fluoridated area: 0.21 |
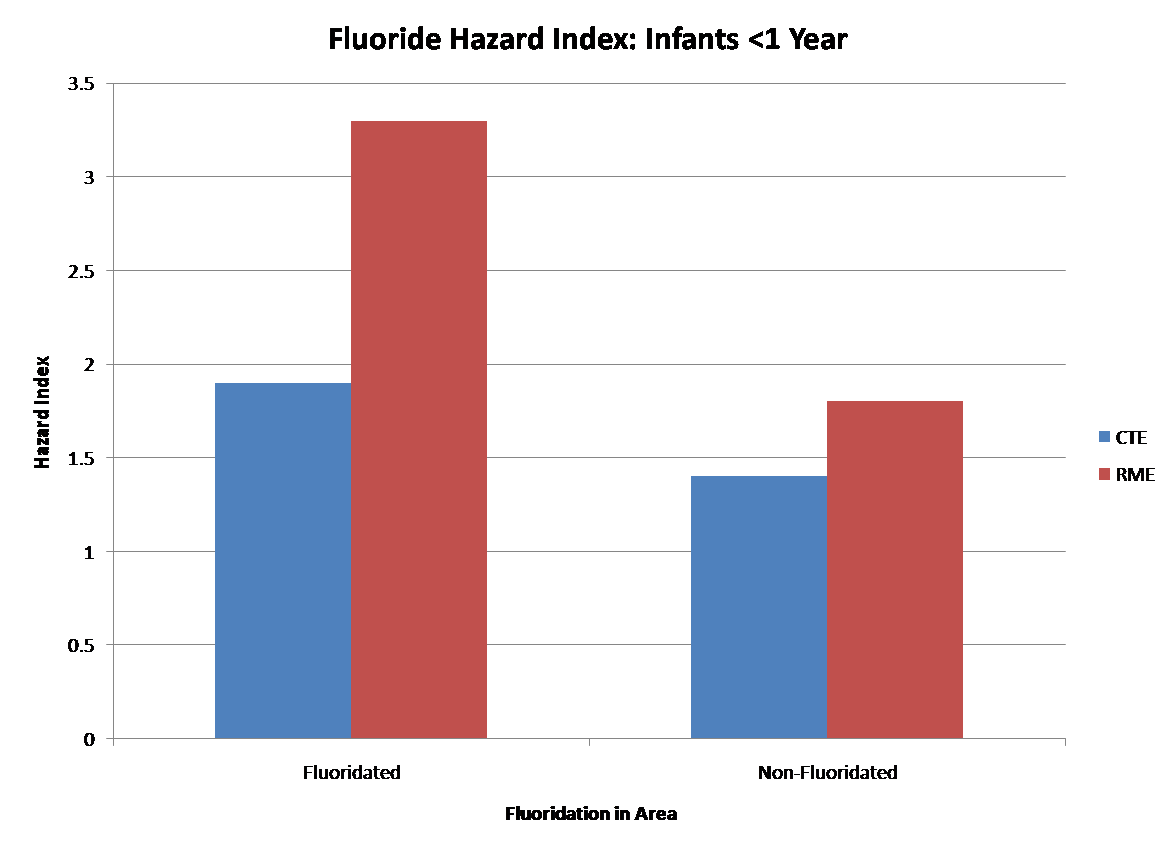
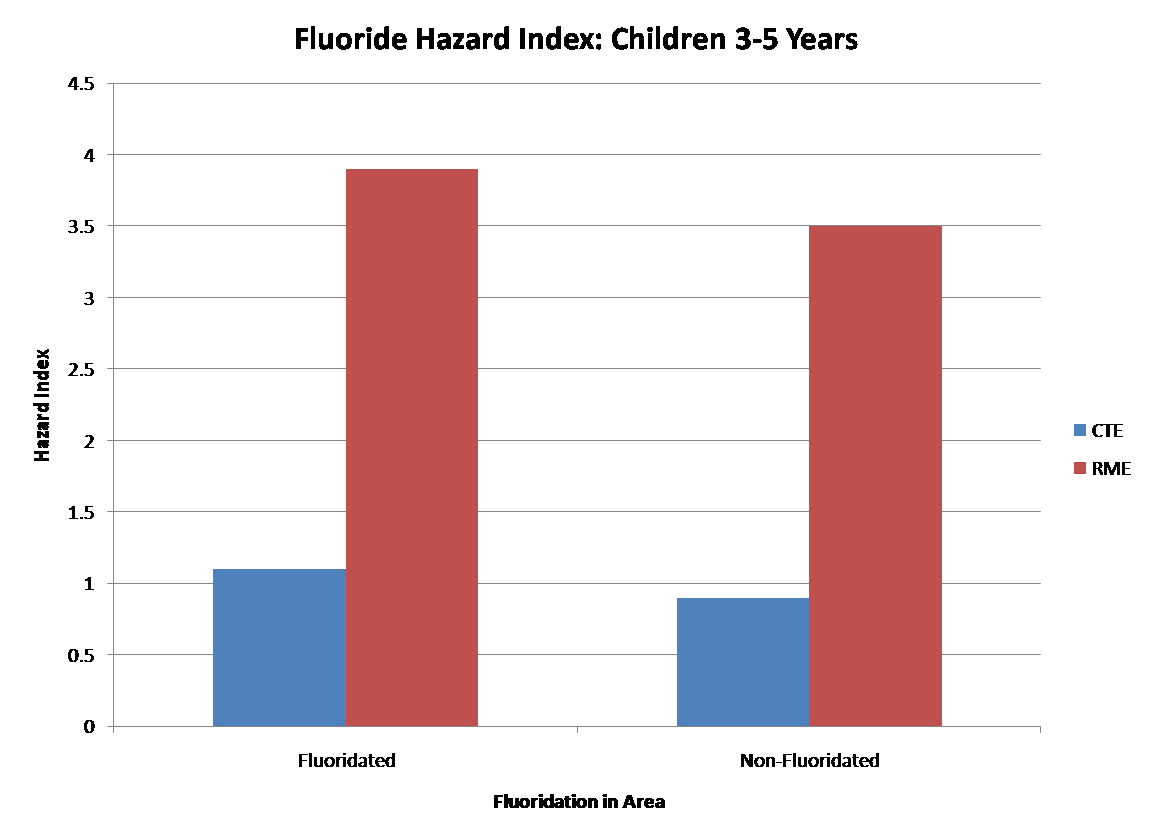
The authors then added CTE and RME exposure for all pathways for the different populations and divided this number by the “reference dose” which is the dose below which there is unlikely to be any deleterious effects (based on US Environmental Protection Agency toxicity values of 0.06mg/kg per day). This provides an index (“hazard index”) of the possible levels of exposure by population. A hazard index is higher than one means that the population is at risk for exposure above the reference dose (0.06mg per day). The reference dose is different than the “tolerable upper limit” set by the US Institutes of Medicine, which is 0.1mg per day.
Uncertainty
The authors acknowledge that the estimates are fraught with uncertainty. While the ranges for some pathways are fairly narrow (e.g., fluoridation in tap water), others tend to be highly variable (e.g., fluoride in soil or from foods). Also, as bottled water (not currently fluoridated) is used in place of tap water in some families, this can lower the cumulative estimated amount of fluoride ingested per day. Overall, the authors characterize the level of uncertainty of their estimates as “medium” at best and most likely “medium to high.”
While the central measure (CTE) of cumulative intake is within the optimum range (0.06mg per day for children, 0.08mg per day for infants) for children in both fluoridated and non-fluoridated areas and infants in non-fluoridated areas, it is estimated to be higher than optimal for infants in fluoridated areas, due in large measure to using fluoridated water for infant formula.
All children and infants in both fluoridated and non-fluoridated areas are over the optimal range when the higher measure of exposure (RME) is used. The authors say that this is due to the fluoride present in infant formula and from exposure to fluoride in toothpaste in children.
The research "raises questions about the continued need for fluoridation in the US municipal water supply to protect against the risk of fluorosis. However, given the uncertainties inherent in this analysis, it is not possible to be conclusive."
| Other: | Not reported |
Strengths
- Combined estimates from various pathways to come up with an overall exposure risk
- Provided both a central measure of exposure as well as a reasonable maximum exposure
- Identified the fact that there is a high level of uncertainty about the estimates due to wide variation in many of the parameters.
Weaknesses
- Provide no indication of how studies of particular exposure pathways were identified
- Provide no detail on the quality of the studies used to provide pathway estimates.
|
Quality Criteria Checklist: Review Articles
|
|||
| Relevance Questions | |||
| 1. | Will the answer if true, have a direct bearing on the health of patients? | Yes | |
| 2. | Is the outcome or topic something that patients/clients/population groups would care about? | Yes | |
| 3. | Is the problem addressed in the review one that is relevant to dietetics practice? | Yes | |
| 4. | Will the information, if true, require a change in practice? | Yes | |
| Validity Questions | |||
| 1. | Was the question for the review clearly focused and appropriate? | Yes | |
| 2. | Was the search strategy used to locate relevant studies comprehensive? Were the databases searched and the search termsused described? | No | |
| 3. | Were explicit methods used to select studies to include in the review? Were inclusion/exclusion criteria specified andappropriate? Wereselectionmethods unbiased? | No | |
| 4. | Was there an appraisal of the quality and validity of studies included in the review? Were appraisal methodsspecified,appropriate, andreproducible? | No | |
| 5. | Were specific treatments/interventions/exposures described? Were treatments similar enough to be combined? | Yes | |
| 6. | Was the outcome of interest clearly indicated? Were other potential harms and benefits considered? | Yes | |
| 7. | Were processes for data abstraction, synthesis, and analysis described? Were they applied consistently acrossstudies and groups? Was thereappropriate use of qualitative and/or quantitative synthesis? Was variation in findings among studies analyzed? Were heterogeneity issued considered? If data from studies were aggregated for meta-analysis, was the procedure described? | Yes | |
| 8. | Are the results clearly presented in narrative and/or quantitative terms? If summary statistics are used, are levels ofsignificance and/or confidence intervals included? | Yes | |
| 9. | Are conclusions supported by results with biases and limitations taken into consideration? Are limitations ofthe review identified anddiscussed? | Yes | |
| 10. | Was bias due to the review's funding or sponsorship unlikely? | Yes | |