NSA: Validity and Reliability Criteria (2018)
Cut Points Used to Interpret Validity, Reliability and Agreement of Adult Malnutrition (Undernutrition) Screening Tools
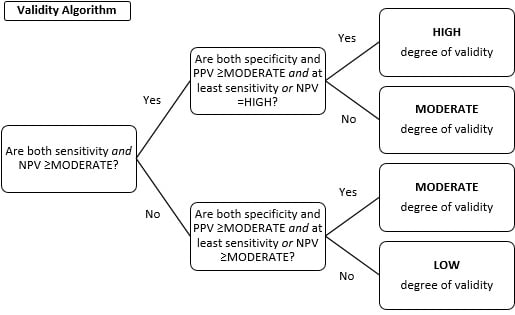
The level of validity, reliability and agreement was assessed for the individual studies, then findings were aggregated for the studies examining each tool, and an overall classification for each of these measures was assigned (Table 1). To determine the overall validity of each malnutrition screening tool, the workgroup applied the aggregated data for sensitivity, specificity, positive predictive value (PPV), and negative predictive value (NPV) for each tool, to the algorithm below (Figure 1) to determine whether validity was high, moderate, or low.
When determining overall validity for a tool, sensitivity and NPV were given more weight than specificity and PPV in the algorithm. This approach reduces the chance of false negatives, that is, identifying an individual as not being at risk for malnutrition when malnutrition is actually present. This is appropriate when evaluating screening tools, since the tool attempts to identify risk and the need for nutrition assessment, as opposed to diagnosis. Similar procedures were followed to determine the overall reliability and agreement for each tool. The kappa statistic was the preferred method of measurement since it is a more robust and conservative estimate compared to other measures of agreement.
| Criteria for Individual Study Results | Overall Classification for Each Tool |
|---|---|
| Validity Resultsa | |
| Se, Sp, PPV, NPV | Overall Degree of Se, Sp, PPV, NPV |
| 90 to 100%, Excellent | High |
| 80 to 90%, Good | Moderate |
| 70 to 80%, Fair | Low |
| 60 to 70%, Insufficient | Low |
| 50 to 60%, Poor | Low |
| Reliability and Agreement Results | |
| Kappa Valueb | Overall Level of Agreement and Reliability |
| Above 0.90, Almost Perfect | High |
| 0.80 to 0.90, Strong | High |
| 0.60 to 0.79, Moderate | Moderate |
| 0.40 to 0.59, Weak | Low |
| 0.21 to 0.39, Minimal | Low |
| 0 to 0.20, None | Low |
Abbreviations: Se=sensitivity, Sp=Specificity, PPV=Positive predictive value, NPV=Negative predictive value
aCriteria were set based on Neelemaat F, Meijers J, Kruizenga H, van Ballegooijen H, van Bokhorst-de van der Schueren M. Comparison of five malnutrition screening tools in one hospital inpatient sample. Journal of clinical nursing. 2011; 20 (15-16): 2,144-2,152. PMID: 21535274.
bCriteria were set based on McHugh ML. Interrater reliability: the kappa statistic. Biochemia medica. 2012; 22(3): 276-282. PMID: 23092060.
Figure 1. Algorithm to determine high, moderate, or low validity for each malnutrition screening tool